Healthcare Simulation is a many-faceted educational methodology which involves staff from varying backgrounds including those with strong technical backgrounds but more limited medical knowledge. Continuing her series on “Physiology: The Force Behind Healthcare Simulation“, here Dr .Kim Baily PhD, MSN, RN, CNE, previous Simulation Coordinator for Los Angeles Harbor College and Director of Nursing for El Camino College, covers an intro to Cardiac Rhythms for Simulation Technicians looking to better understand patients. Developing simulation technicians (operation specialists) knowledge of physiology would likely increase their ability to participate, plan and support the nursing simulation activities which in turn improve student learning. Many clinical simulation scenarios involve a change in patient status which often includes a change in cardiac function along with cardiac dysrhythmias. This article introduces cardiac physiology and how to interpret basic cardiac rhythms.
Review of Basic Cardiac Physiology
- The heart is a pump made up of four chambers (right and left atria, right and left ventricle) composed of specialized cardiac muscle cells which contract in an organized fashion. Blood leaves the left ventricle with sufficient pressure to overcome the resistance of the systemic circulation and then circulate oxygenated blood to all areas of the body. Failure of the cardiac pump will quickly lead to hypoxia and death.
- Specialized cardiac muscle cells possess electrical properties which enable them to communicate very rapidly with each other. This property is said to be intrinsic i.e. comes from within. If a heart is removed from the body, it will continue to beat until it runs out of oxygen. Each cardiac cell has an electrical charge across its cell membrane which can rapidly change once a threshold has been reached. Ions move in and out of the cells causing a depolarization of the cell followed by muscle contraction and the forward movement of blood from one chamber to the next. Note it is the pressure of blood against the cardiac valves between chambers and the aorta that opens the valves and allows movement of blood through the valves.
- If the cardiac cells can contract independently, what causes the controlled contraction of the heart chambers in a smooth organized way?
Next, let’s take a look at electrical systems in the heart!
Electrical Conduction System of the Heart
- In the right atria a group of cells known as the sinoatrial node contracts at the rate of about 70 beats per minute. This is the fastest intrinsic rate within the heart. The signal spreads almost instantaneously throughout the atria to the Atrioventricular node (AV node). Here the signal pauses and then moves rapidly down through the bundle of His and purkinje fibers to spread out through all the ventricular cells. The time for a signal to leave the SA node and reach the last ventricular cell is about 0.22 seconds.
- The heart needs to contract from the apex of the heart (which is towards the head) to the base of the heart otherwise, it would be like squeezing a tube of toothpaste from the top – nothing would come out.
- The rate at which heart cells beat spontaneously depends on where the cells are located within the heart
- The SA beat around 70
- AV node cells beat 50
- Ventricular cells beat 30-40
- The cells that beat the fastest dominates the heart rate.
- So long as the heart is healthy and there is communication along the usual pathways the heartbeat and contraction is initiated at the SA node.
- The SA node contraction rate can be altered by nerves that end at the node. The sympathetic nerves speed up the heart (flight or fight system) while the parasympathetic slows it down (rest and digest). In addition, circulating hormones such as catecholamines e.g adrenaline can speed up the sino atrial node.
- Heart rate (beats per minute) can easily be measured by taking the pulse or auscultating the chest with a stethoscope.
- Normal 60-100
- > 100 Tachycardia
- <60 Bradycardia (may be normal in some athletes).
- Heart Rhythm: Is the heart rate regular or irregular? Does there appear to be skipped beats or extra beats? Is there a pattern to the irregularity or is the rhythm completely irregular? Basic vital signs can provide very useful information about cardiac function and should never be skipped.
Basic Measurement of ECG Waveform
The components of the cardiac cycle can be visualized on an electrical recording of the heart. When surface electrodes (leads) are attached to the skin, electrical activity in cardiac cells can be collected, integrated and displayed on a screen or printed on paper. The original work was developed by Walter Einthoven who described a triangle of activity around the heart (Einthoven’s triangle). For a full ECG, 12 electrodes, attached at various points around the body, measure the sum of electrical charge moving from one EKG lead to another. Lead one, for example, attached to the left arm lead is designated as positive while the right arm lead is designated as negative. When electrical signals move towards the positive lead, the electrical wave moves up from baseline and when the electrical signal is reversed the wave moves in the opposite direction. Basic analysis of ECGs looks at movement away from the baseline either up or down and the distance between the waves.
Waves and Complexes
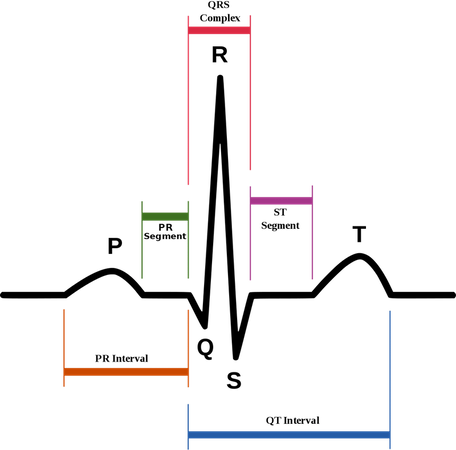
- Isoelectric line: This is the place on an ECG waveform where positive and negative electrical charges are balanced. Waves represent depolarization and repolarization of the atria and ventricles of the heart.
- P wave: After the SA node “fires”, a signal spreads rapidly through the atria to the AV node. This generates a wave which mimics the depolarization of the atria.
- QRS complex: The QRS complex is the combination of three deflections which correspond to the depolarization of the right and left ventricles and the contraction of the large ventricular muscles. In adults, the QRS complex normally lasts 0.06–0.10 s; in children and during physical activity, it may be shorter. The Q, R, and S waves occur in rapid succession, do not all appear in all leads, and reflect a single event and thus are usually considered together. A Q wave is any downward deflection immediately following the P wave. An R wave follows as an upward deflection, and the S wave is any downward deflection after the R wave.
- There is only one type of complex.
- T wave: Follows the S wave and corresponds to the ventricular repolarization. Both the atria and ventricles have to repolarize before another contraction can occur.
- The atrial repolarization is hidden within QRS
- U Wave: Occasionally, a small additional wave follows the T wave and is usually in the same direction as the T wave but shaped like a P. This is thought to be the late repolarization of the Purkinje fibers.
Intervals: An interval is the length of a particular wave plus the isoelectric line that follows it; the length of the interval ends when another wave begins. The internal is named using both of waves on either side. Note Intervals contain waves.
- PR interval: The period of time from the onset of the P wave to the beginning of the QRS complex is termed the P-R interval, which normally ranges from 0.12 to 0.20 seconds in duration. This interval represents the time between the onset of atrial depolarization and the onset of ventricular depolarization. The P-R interval includes the delay in the AV node.
- QT interval: The period of time/length of the baseline from the beginning of the QRS complex to the end of the T wave. This represents ventricular depolarization and repolarization. If a U wave present, measure to the end of the U wave.
Segments: Baseline between the end of one wave and the beginning of the next wave. Segments are always straight:
- ST segment: The end of S wave and beginning of T wave
- PR segment: The end of P to beginning of PQR complex
Simple Analysis of ECG: The ECG is printed on specially marked paper where the horizontal axis represents time with each small block = 0.04 sec and each large block (with 5 small squares) = 0.2 seconds. The vertical axis represents voltage.
- Determining rhythm: Determine if the rhythm has a regular pattern. Is the time between P waves equal and how many P waves occur in one minute. This information yields the atrial contraction rate and its regularity.
- Measure the R to R distance – ventricular rhythm. How many QRS complexes per minute and are they equally spaced.
- Is there one P wave for every QRS or are their extra P waves or QRS complexes.
- Measure intervals and segments including PR interval, ST segment, and QT.
- Are Q waves present.
Normal Sinus Rhythm
- Rate of 60-100 bpm (or age-appropriate rate in children).
- Each QRS complex is preceded by a normal P wave.
- P-R interval ranges from 0.12 to 0.20 seconds
- The QRS complex lasts between 0.06–0.10 s
- Regular rhythm with equal time between the P waves and QRS complexes. No extra waves or early beats. Each cardiac cycle is evenly spaced.
- 12 lead: Normal P wave axis: P waves should be upright in leads I and II, inverted in aVR.
Additional Reading: How To Read An Electrocardiogram (EKG/ECG) from Nurse.org
Subscribe now for future articles will cover various dysrhythmias and more details about the 12 lead ECG!
Read the Entire Physiology: The “Force” Behind Healthcare Simulation HealthySimulation.com Article Series:
- Part 1: Blood Pressure
- Part 2: Heart & Respiratory Rate
- Part 3: Pulse Oximetry
- Part 4: Diabetes
- Part 4B: Hypoglycemia & Excel Template for Simulated EHR
- Part 4C: Insulin
- Part 5: Sepsis
- Part 6A: Hypovolemia (Intro)
- Part 6B: Hypovolemia (Treatment & Simulation Tips)
- Part 7A: IV Fluids & Bags
- Part 7B: IV Pumps & Site Access
- Part 7C: PCA for Pain
- Part 8: ABGs
- Part 9: Sepsis Labs
Have a story to share with the global healthcare simulation community? Submit your simulation news and resources here!


