Some simulation team members may have a limited background in physiology or medicine. An understanding of basic physiological concepts can enable non medical simulationists to better understand medical simulation. This article is the second in a series of posts related to physiology, the force behind simulation. The first article entitled Physiology – the Force Behind Healthcare Simulation discussed an overview of blood pressure. This post covers the other vital signs – heart rate (pulse), respiratory rate, and temperature. (Note: See the entire series linked at the bottom of this article).
Vital signs provide key information about the physiological status of a patient. The body is constantly changing in response to internal and external stressors. Some of these changes can be seen in changes to the vital signs. For example, when someone exercises, working muscles need more oxygen. The body responds by increasing heart rate and blood pressure. This results in more blood and hence more oxygen circulating to the working muscles. As the respiratory rate increases oxygen moves from the lungs to blood in the pulmonary circulation and at the same time, the waste product of metabolism carbon dioxide is eliminated. This is a normal physiological response. Pathological changes can also lead to changes in vital signs. Careful monitoring of vital signs can provide clues to the clinician about a patient’s response to illness or how a patient is responding to interventions.
Heart Rate:
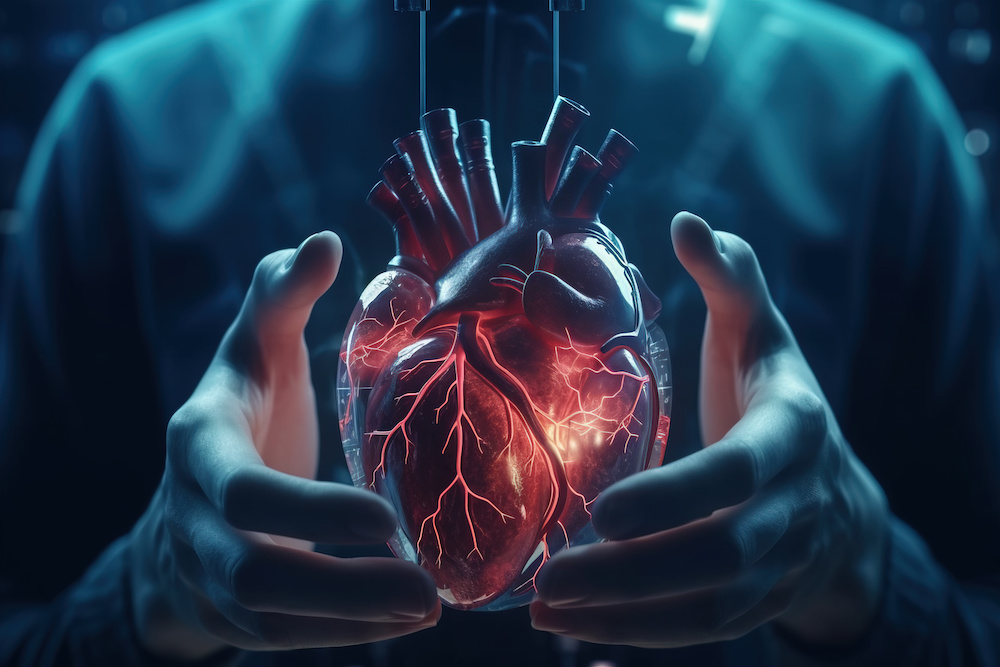
- The heart if composed of four chambers left and right atria and left and right ventricles.
- Myocardial cells (heart cells) have specialized properties.
- The cells can pass an electrical charge from one cell to another
- This property is intrinsic i.e. comes from within.
- A heart will continue to beat after removal from the body until the oxygen supply is exhausted.
- In the right atria, a group of cells known as the sinoatrial node (SA node) contract at about 70 beats per minute in the adult.
- Once the sinoatrial node cells contract, the electrical signal spreads almost instantaneously throughout the atria.
- At the junction of the atria and ventricles, the atrioventricular node (AV node) causes the signal to pause before it spreads down into the ventricles.
- Upon entering the ventricles the signal spreads rapidly down the ventricles through the bundle of His and purkinje fibers.
- The electrical activity (depolarization) of the atrial causes the atria to contract a fraction of the second before the ventricles.
- This is key because the atria need to empty into the ventricles before the ventricles contract.
- Loss of the contraction of the atria results in a 20% loss of cardiac output.
- Atrial dysrhythmias such as atrial fibrillation can have a significant impact on cardiac output.
- The SA node beats around 70 beats/min, the AV node around 50 beats/min and the Ventricles beat between 30-40 beats/min.
- So long as the cells are connected, the cells with the highest rate will dominate and the heart will beat at this rate.
- If there is a blockage in the pathway, for example a complete heart block, the ventricular rate will take over and the heart rate will be 30-40.
- Heart rhythms may be irregular. E.g.:
- Irregularly irregular as in atrial fibrillation – no pattern at all
- Skipped beats such as premature ventricular contractions (PVCs). There may be a pattern to this, e.g. every third beat or every now and then.
- Medical surgical floors do not routinely have cardiac monitors so information about rhythms is obtained from palpating a pulse or listening to the chest.
- Do not provide a monitor if the scenario setting is in a clinical area where a monitor would not typically be found.
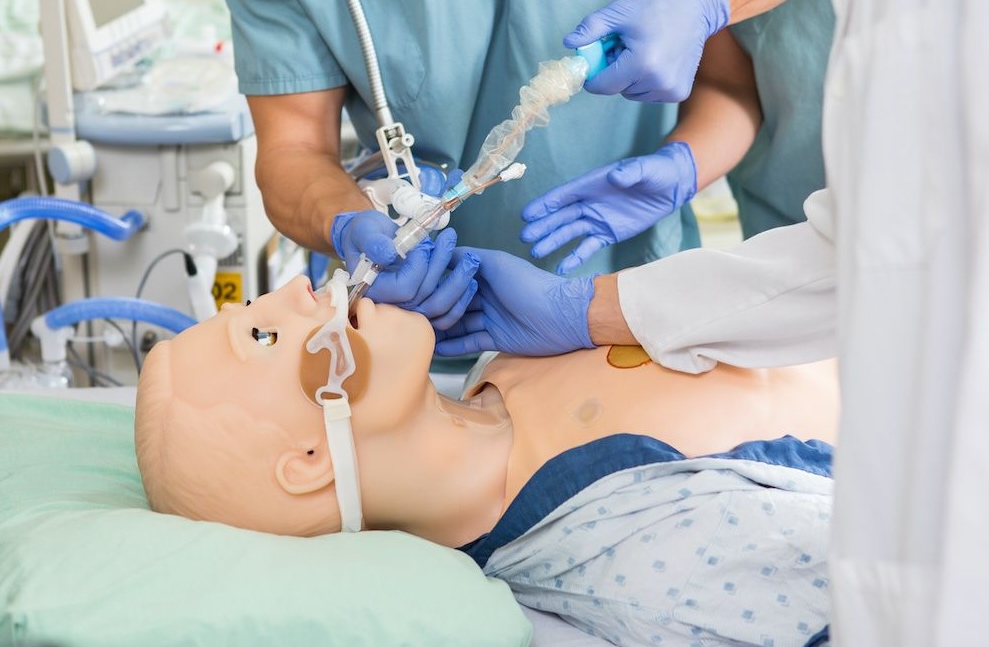
- Vital sign machines provide information on the rate in beats/min but do not provide information about the nature (bounding, weak, thready) of the pulse or heart rhythm. Students should be encouraged to palpate pulses to obtain more information about cardiac rhythm. Changing the rhythm on the manikin improves learners assessment skills.
- Tachycardia – heart rate >100 in the adult.
- Bradycardia – heart rate <60 (maybe normal in some athletes) in the adult.
- Heart rate changes with age:
- Neonate: From 80 to 180 beats per minute
- Infant: From 100 to 160 beats per minute
- Toddler: From 90 to 140 beats per minute
- Pre School Child: From 80 to 110 beats per minute
- School Age Child: From 70 to 100 beats per minute
- Adolescent: From 60 to 100 beats per minute
- Adult: From 60 to 100 beats per minute
- Heart rate tends to increase or become irregular in response to:
- Hypoxia
- Anemias
- Hemorrhage
- Thyroid disease
- Fever
- Emotional Stress
- Cardiac and lung diseases
- Certain drugs including cocaine.
- Exercise
- Smoking
- Caffeine
- Excess alcohol
- Heart rate decreases:
- Coronary artery disease
- Athletes
- Drugs e.g. beta blockers, digoxin
- Hypothyroidism
- Electrolyte imbalance eg potassium
- Vagal stimulation.
Respiratory Rate
- Respiratory Rate is the number of breaths per minute
- Neonate: From 30 to 60 per minute
- Infant: From 30 to 60 per minute
- Toddler: From 20 to 40 per minute
- PreSchool Child: From 22 to 30 per minute
- School Age Child: From 20 to 26 per minute
- Adolescent: The same as the adult from 16 to 22 per minute
- Adult: From 16 to 22 per minute
- The breathing pattern also noted.
- Tachypnea (Fast)
- Bradypnea (Slow)
- Deep/shallow
- Apnea
- Eupnea (normal)
- Cheyne-Stokes
- Gradual increase in volume and frequency, followed by a gradual decrease in volume and frequency, with apnea periods of 10 – 30 seconds between cycle.
- Kussmaul’s respiration.
- Increased rate and depth of breathing over a prolonged period of time.
- Respiratory Rate Increases:
- Increased oxygen demand such as exercise
- Increased carbon dioxide from metabolic acid states such as ketoacidosis (diabetes)
- Anxiety
- Sepsis
- COPD
- Asthma
- Allergic reactions
- Foreign body
- Congestive heart failure
- Respiratory Rate Decrease
- Medications – e.g. anesthetics, opioids
- Degeneration of heart tissue because of aging
- Damage to tissues in the heart from heart attack or heart disease
- High blood pressure or hypertension
- Hypothyroidism or underactive thyroid gland
- Obstructive sleep apnea
- Inflammatory disease, such as lupus or rheumatic fever
Temperature.
- The average normal body temperature is generally accepted as 98.6°F (37°C) although normal body temperature can have a wide range, from 97°F (36.1°C) to 99°F (37.2°C).
- Temperature may be taken by a variety of routes
- Oral, tympanic, rectal, axillary, tympanic, bladder, skin of the forehead.
- Temperatures greater than 100.4 may be considered a fever.
- Normal temperature – afebrile
- Core body temperatures – central body temperature. Peripheral of body may be considerably colder.
- Elevated temperature
- Deliberate response to infection – virus or bacteria
- Think of the hypothalamus in the brain as a thermostat which is changed in response to infection
- Inability of the body to maintain normal temperatures
- Heat exhaustion – normal cooling mechanisms have failed.
- Certain inflammatory conditions such as rheumatoid arthritis
- A malignant tumor
- Some medications, such as antibiotics and drugs used to treat high blood pressure or seizures
- Some immunizations, such as the diphtheria, tetanus and acellular pertussis (DTaP) or pneumococcal vaccine
- High temperatures can cause fever, particularly in children.
- Deliberate response to infection – virus or bacteria
- Hypothermia 95 F (35 C). Causes:
- Exposure to cold.
- Alcohol intoxication
- Low blood sugar
- Anorexia
Many simulation scenarios involve an assessment of vital signs. Make sure students obtain a complete set. Skipping one or other vital sign may lead to a misinterpretation of a patient condition. Oxygen saturation will be discussed in another post.
Set up the scenarios so that students have access to previous vital signs. Trending and interpreting changing vital signs is a key clinical skill. A spiking fever, a gradual increase in heart rate, a sudden change in blood pressure may be more significant than a single abnormal value. For example a blood pressure of 140/86 though above normal may be the usual blood pressure for a patient whilst 100/60 may be the normal for another. If however, a patient with a blood pressure of 150/88 for the past 3 days suddenly drops to 96/60 there is likely a problem. Learners will be able to make more informed clinical decisions if they have the ability to assess vital sign trends.
Read the Entire Physiology: The “Force” Behind Healthcare Simulation HealthySimulation.com Article Series:
- Part 1: Blood Pressure
- Part 2: Heart & Respiratory Rate
- Part 3: Pulse Oximetry
- Part 4: Diabetes
- Part 4B: Hypoglycemia & Excel Template for Simulated EHR
- Part 4C: Insulin
- Part 5: Sepsis
- Part 6A: Hypovolemia (Intro)
- Part 6B: Hypovolemia (Treatment & Simulation Tips)
- Part 7A: IV Fluids & Bags
- Part 7B: IV Pumps & Site Access
- Part 7C: PCA for Pain
- Part 8: ABGs
- Part 9: Sepsis Labs
Today’s article was guest authored by Kim Baily PhD, MSN, RN, CNE, Simulation Coordinator for Los Angeles Harbor College. Over the past 15 years Kim has developed and implemented several college simulation programs and currently chairs the Southern California Simulation Collaborative.
Have a story to share with the global healthcare simulation community? Submit your simulation news and resources here!


